Freight on the RADAR: Freight Slows, Costs Climb

A weekly economic snapshot of the transportation industry by Amanda Radwanski, PhD
This is the Freight on the RADAR Report, a snapshot of economic indicators relevant to the brokerage industry. Below is a summary of relevant economic indicators, a broader dashboard available to TIA members is forthcoming.
Amanda is TIA’s economist and previously worked at the U.S. Small Business Administration and the World Bank Group. Her research background includes international trade and how policies and institutions shape exports. At TIA, she is working to give members more timely, actionable insight into the freight market. Amanda will help members make sense of the freight economy through the weekly Freight on the RADAR report and TIA’s quarterly market report.
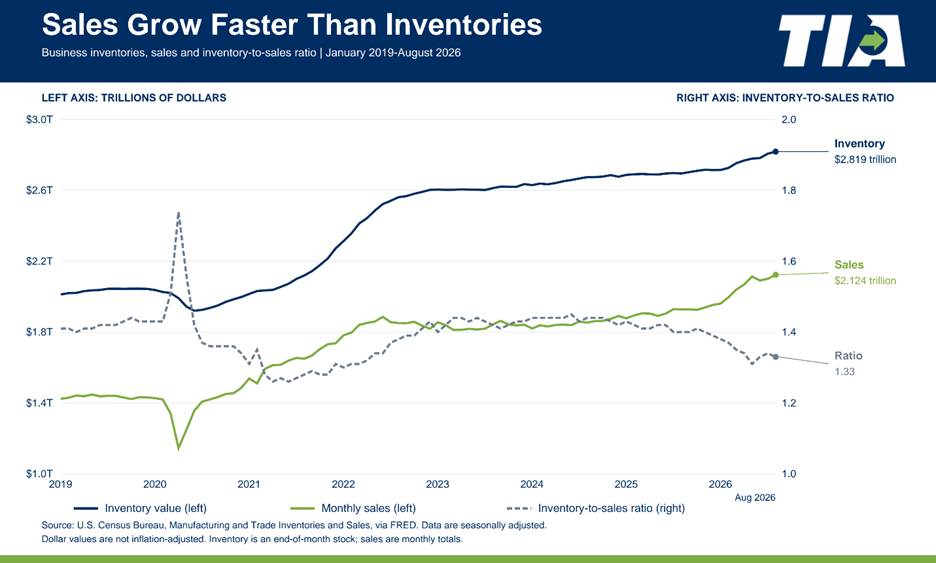
Summary: New transportation data illustrates a mixed near-term outlook for brokers: while overall freight activity remains soft, growth in selected manufacturing industries points to pockets of opportunity. Sales have generally grown faster than inventories for more than a year, pushing the inventory-to-sales ratio downward and potentially supporting future replenishment demand. At the same time, higher fuel and other producer prices dampen the overall market outlook.
Some Industries Grow as Freight Activity Falls
🏭 September production showed year-over-year gains in computer/electronic products (+9.5%), machinery (+6.9%), and wood products (+1.5%), and fabricated metals (+3.3%). While overall manufacturing output increased (+1.1%), production of food, beverages, and tobacco (-1.5%), chemicals (-1.3%) and motor vehicles/parts (-0.8%) declined, showing uneven conditions across freight-generating industries. Overall industrial production rose 0.7% in September and 2.2% year-over-year, as shown in the figure below. Source: Federal Reserve
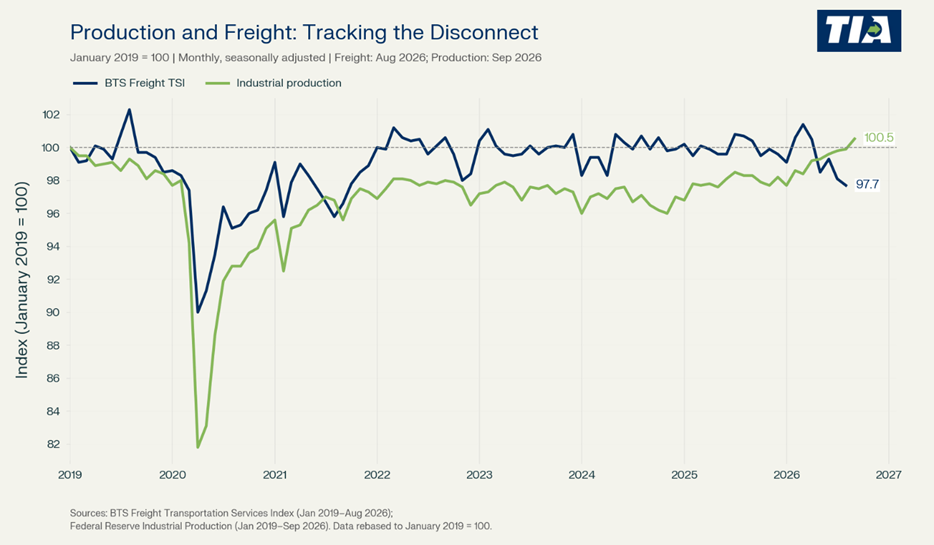
Alongside uneven growth across industrial sectors, the Bureau of Transportation Statistics’ Freight Transportation Services Index (BTS Freight TSI) showed that for-hire freight activity fell 3.0% year over year and 0.4% in August, suggesting that growth in some industries has not translated into broad freight-volume growth. Source: U.S. Bureau of Transportation Statistics
Sales Grow Faster Than Inventories
The inventory-to-sales ratio fell from 1.40 to 1.33. This means that for every $1 in monthly sales, businesses held $1.33 in inventory, down from $1.40 a year earlier. The ratio declined because sales increased 10.2% year-over-year, while inventory value increased 4.6%. Source: U.S. Census Bureau
High fuel prices dominate producer price index changes.
Producer prices rose 6.3% year over year in September 2026, with sharp increases in fuel prices, including diesel at 115.2% and lubricating oil base stocks at 149.5%. Truck and water freight prices each increased 19.3%, while freight-arrangement prices rose 3.6% and warehousing prices increased 2.5%. Source: U.S. Bureau of Labor Statistics
PPI: Producer prices and freight-business costs
| Category | Sep 26-Sept 25, YoY Price change |
| Overall PPI—final demand | +6.3% |
| Lubricating oil base stocks | +149.5% |
| Home heating oil and distillates | +117.5% |
| No. 2 diesel fuel | +115.2% |
| Truck transportation of freight | +19.3% |
| Water transportation of freight | +19.3% |
| Truck trailers | +9.5% |
| Air transportation of freight | +6.4% |
| Truck, utility-trailer and RV rental/leasing | +3.7% |
| Arrangement of freight and cargo | +3.6% |
| Warehousing, storage and related services | +2.5% |
| Rail transportation of freight and mail | +1.3% |
| Heavy motor trucks | +0.8% |